Does
Candlestick chart patterns predict the future movement of stocks accurately?
Don’t fall for it.
However, if you use chart patterns correctly then you may find high probability trading opportunities.
Read also:
8 Trading Strategies That Help You Find Winning Trade
Crossover Day Trading Strategy: Ultimate Trade Set Up [2020]
ORB Trading Strategy: Winning Trade Set Up With 90% Accuracy
With the help of candlestick chart patterns, you can gauge the market conditions so you know whether to buy or sell.
Moreover, it also gets you out of losing trades quickly and manage your risk properly.
So, you must know each and every chart pattern if you want to be a winner in the stock market.
Well, you may be wondering how you are going to memorize all chart patterns.
In fact, there may be hundreds of chart patterns available and memorizing all of them will burn you out.
Hence, either you figure out how to keep the chart patterns in your head or just learn the price action of the markets.
Which one do you like to do?
Price Action?
Hmm…
Then go on and read this post till the end and you will amaze how you see what market is doing.
The Trend is Your Friend
You might hear this million times that trend is our friend. However, you are still not able to catch and follow our friend and instead, we do what we believe.
So, comment honestly if you are following trends while trading.
Forget about hundreds of chart patterns, in fact, you don’t need to memorize a single chart pattern if you know this.
Perhaps you know that the market always moves either in trend or sideways.
So, all you need is to figure out whether the market is trending or remain rangebound.
You will make money from the stock market if you know when to enter and when to stay out. Hence always look for a clear trend to enter and exit.
If the price is making continuous swing Higher Highs and Higher Lows, then the market is bullish or in an uptrend.
On the other hand, if the price is making swing Lower Highs and Lower Lows, then the market is bearish or in a downtrend.
In case the price is not making new highs or lows, then you can consider it as in a range.
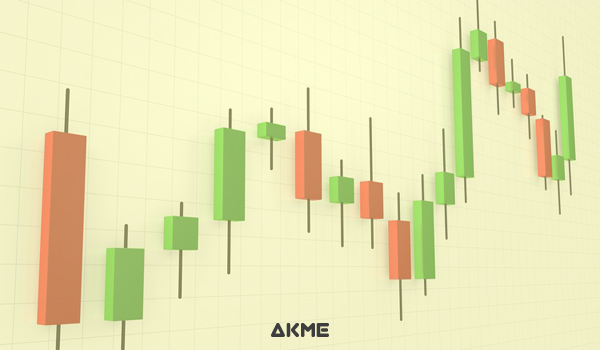
Price moves in a zig-zag path and if it moves with strong and large-bodied candles then it signals you a strong move.
Whereas, if the price moves with small-bodied candles then you may consider that the move is weak.
Trend Continuation Candlestick Chart Patterns
If you want to ride with the trend, then you need to follow some of the trend continuation chart patterns.
These chart patterns let you identify that stock is in trending move. It may be either follow downtrend or uptrend.
Either way, you’ll make money if you are able to catch the trend.
Sounds good!
Then let’s catch some of the trend continuation patterns.
Flag Pattern
You will find a Flag pattern on the chart that looks like a Flag. It is one of the trend continuations of
candlestick chart patterns.
Normally, you may find that the Flag Pole is driven by strong momentum. At the same time, the volume is also shooting up. That gives you double confirmation that the trend might continue further.
It is a strong chart pattern and I found it usually reliable and most of the time my target gets hit.
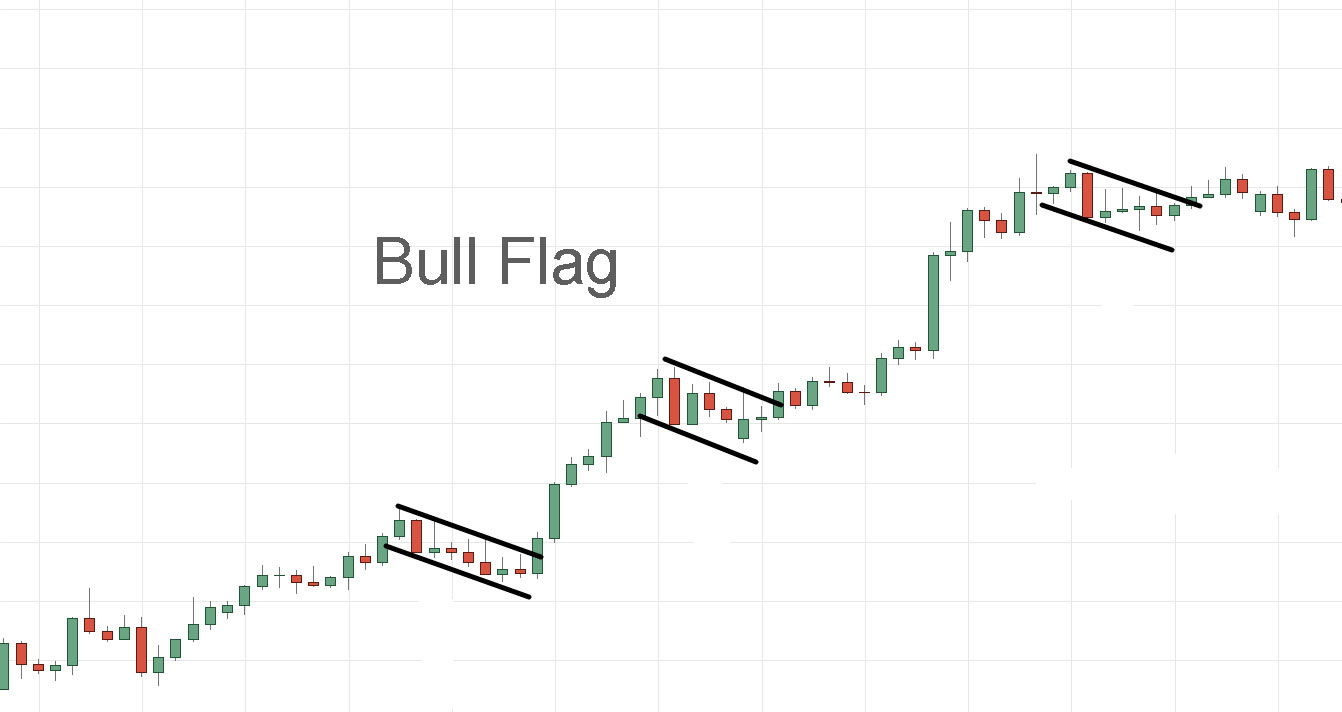
Now Flag pattern either may be Bull Flag or BearFlag. If you found a trend is bullish, look for the Flag pattern.
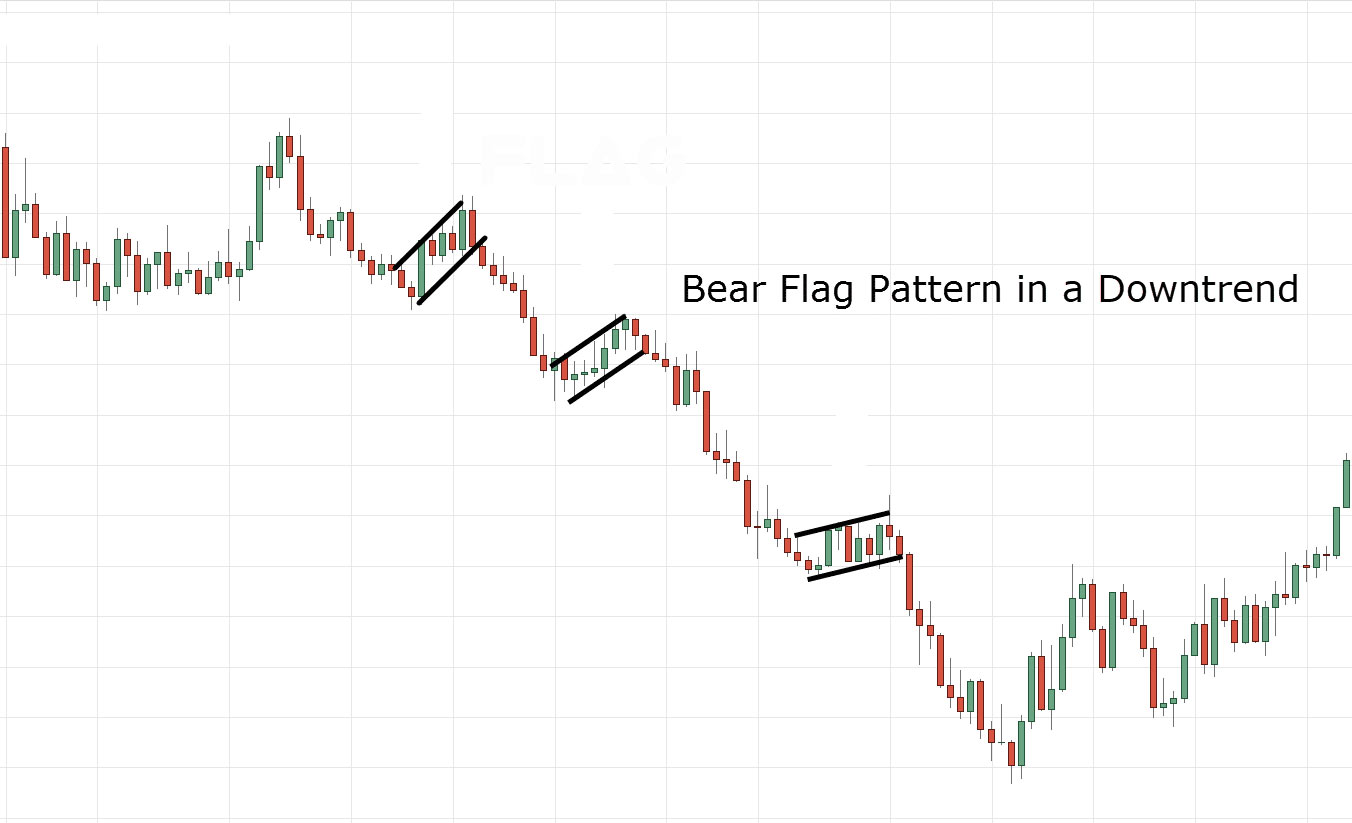
Remember one thing that you won’t find exact Flag pattern every time. So, there are other variations of Flag pattern like Symmetrical Triangle or Pennant.
A pennant is a small symmetrical triangle consolidation phase. It begins with a wide range and tends to end with a narrow range as the pattern develops.
Trend Reversal Chart Patterns
Trend reversal chart patterns help you to figure out likely change of current trend.
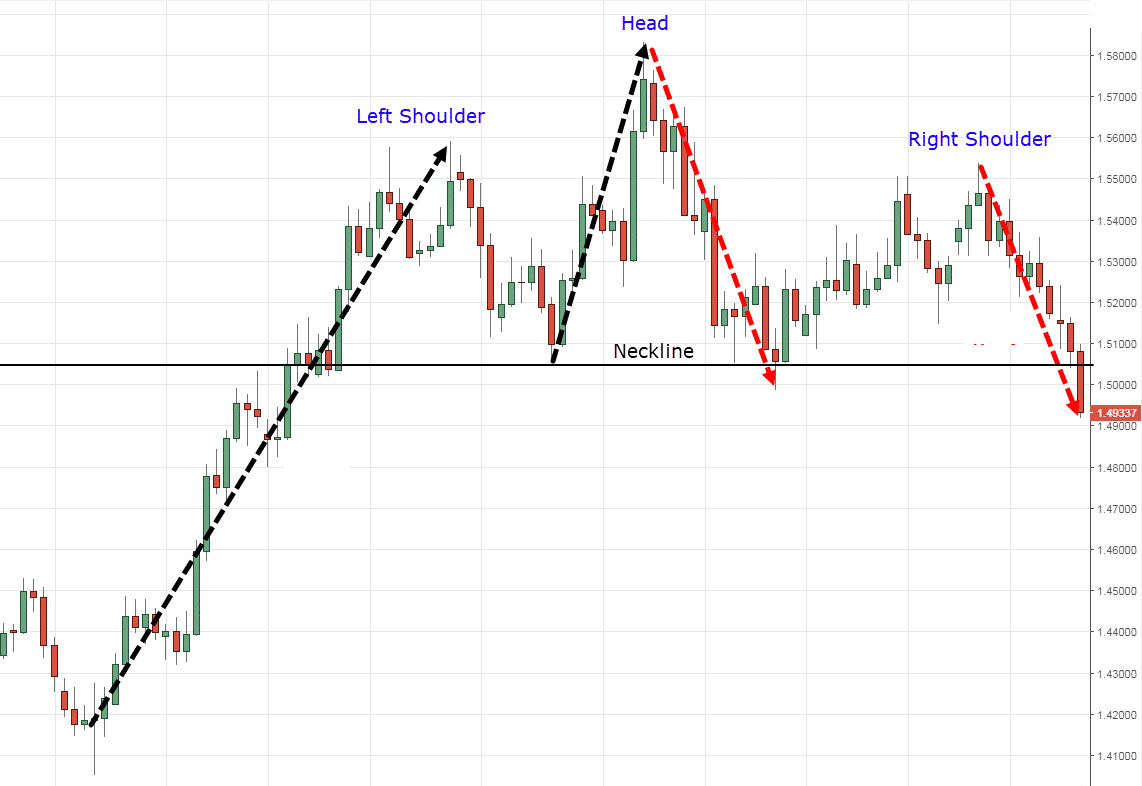
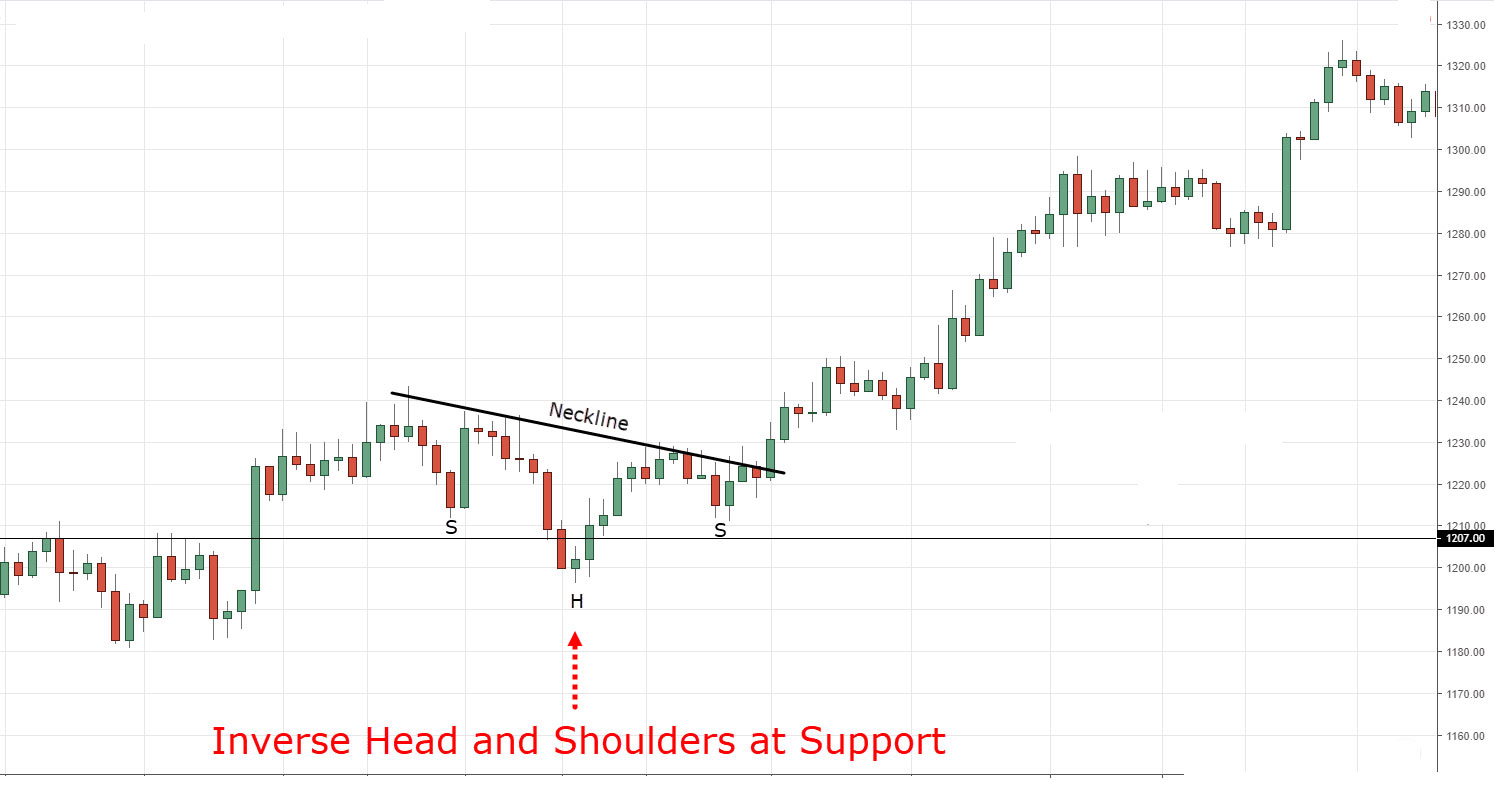
Head and Shoulder
‘Head and Shoulder’ is one of the famous trend reversal chart patterns. You need to train your eyes to spot the Head and Shoulder patterns.
Normally, it has three peaks and the middle peak is the highest peak. The middle peak is considered as Head and the other two peaks are called Left and Right Shoulder.
If the market is bullish and you are wondering to enter at the reversal, then look for ‘Head and Shoulder’ pattern. However, if you are planning to go long, then look for Inverse Head and Shoulder pattern.
After a strong uptrend, the market likely to breathe for some time. At that stage, you may find ‘Head and Shoulder’ patterns.
It suggests that a possible trend change as the buyers are getting weak and unable to push the price higher.
On the other hand, after a strong downtrend, you may find an ‘Inverse Head and Shoulder’ pattern. It signals you that the sellers are not able to push the price lower further.
Double and Triple Top
Double Top and Triple Top chart patterns are also a trend reversal patterns. You may find these patterns at the top.
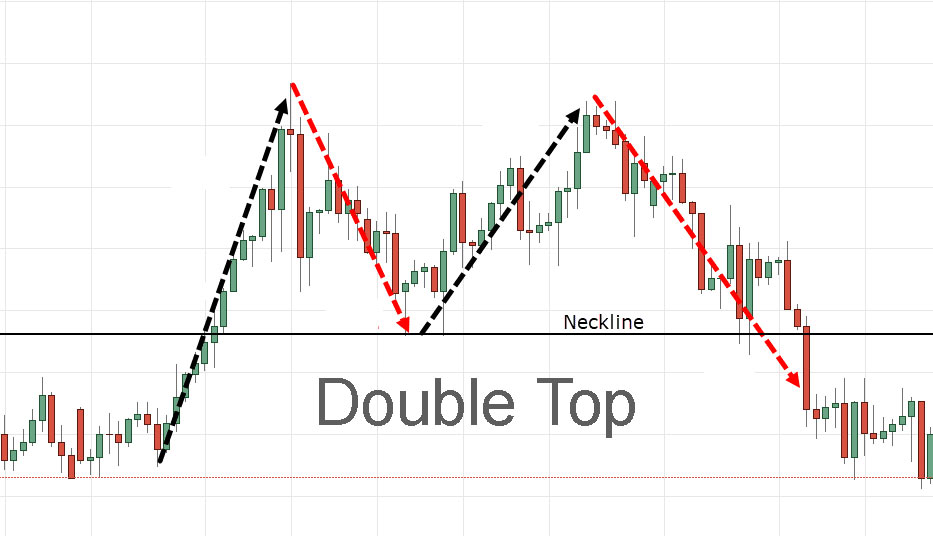
On the contrary, Double Bottom and Triple Bottom chart patterns are formed at the bottom of the downtrend.
Now, you have probably understood the chart patterns and you’re itching to trade with these patterns.
However, you are wondering which chart patterns are the most profitable.
Right?
In fact, the truth is…
It doesn’t really exist as there are no such things as profitable.
Why?
Because market conditions are so dynamic that any chart patterns can fail.
For instance, if the market is in a downtrend, then any bullish chart patterns will fail as the trend is down.
Moreover, if the market is in an uptrend, then trend reversal chart patterns won’t do well as the trend is up.
And as you heard that trend is our friend and so we have to trade with the trend only to be profitable.
Agree?
So, it will be better to forget about trying to find out the most profitable chart patterns. Instead of that try to identify the current market structure and then trade accordingly.
Now here’s what I’d like to know…
Which chart patterns do you love to trade and why?
Leave a comment below and share your thoughts with me.
Moreover, if you like this post, then don’t forget to share it on your social networks.
Published on: April 6, 2020